low of large numner (データ解析)
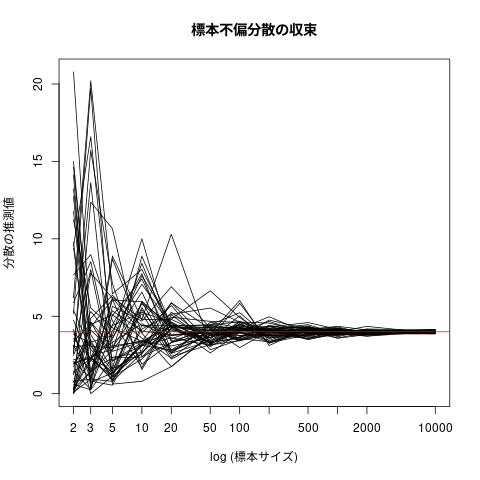
推定量の一致性 (大数の法則)の可視化
出展: http://tomoshige-n.hatenablog.com/entry/2016/06/07/233959
# set.seed(20211025)

# 真の偏差
true = 2

# 標本サイズ
n.cand = c(2,3,5,10,20,50,100,200,500,1000,2000,10000)

# 標本数
j.num=50

# 標本不偏分散値の保存場所
res = matrix(0,length(n.cand),j.num)

# i: 標本サイズの添字
# j: シミュレーション順番

for(i in 1:length(n.cand)){
  for(j in 1:j.num){

    # j番目のシュミュレーションのための
    # 標本サイズ n.cand[i]の
    # 正規分布にしたがう無作為標本の生成
    x = rnorm(n.cand[i], mean = 0 , sd = true)

    # 標本の不偏分散値の保存
    res[i,j] = var(x)
  }
}

for(j in 1:j.num){
  if(j==1){
    plot(log(n.cand),res[,j],type="l",
         ylim=c(min(res),max(res)),
         main="標本不偏分散の収束",
         ylab="分散の推測値",
         xlab="log (標本サイズ)",xaxt="n")
    axis(1, at=log(n.cand), labels=n.cand)
  }else{
    points(log(n.cand),res[,j],type="l") ## type="l"は折れ線, "p"は点のみ
  }
}

# 母分散値
abline(h=true**2,col=2)
curve(x*dnorm(x,mean=1,sd=1), 0, 10)
curve(dnorm(x,mean=1,sd=1), 0, 10, add=TRUE)
curve((x-1)^2*dnorm(x,mean=1,sd=1), -5, 10)
curve(dnorm(x,mean=1,sd=1), -5, 10, add=TRUE)